Melbourne crane count steady amid ‘Big Build’
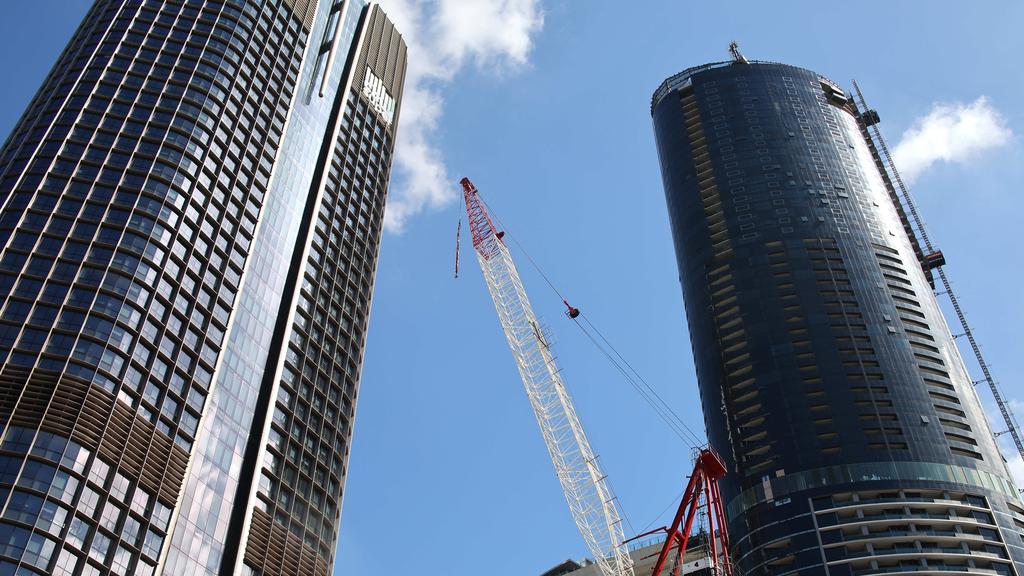
Cranes working on construction sites in Brisbane. Picture: David Clark
Sydney is leading a national count of cranes – a proxy for construction activity – while Melbourne continues to lag, according to the RLB Crane Index.
Of the 845 cranes operating nationwide, 370 are located in Sydney, followed by just 199 in Melbourne, with two fast-growing Queensland cities rising to 140 in total – 73 in Brisbane and 67 on the Gold Coast.
RLB noted the difference between Sydney and Melbourne remains significant, at 171 cranes, but said the overall construction sector was keeping up a healthy pace with the number of cranes operating bumping from 840 on a national basis. This is well above the long-term average of 775.
Rider Levett Bucknall’s Oceania director of research and development, Oliver Nichols, pointed out of the industry’s healthy state.
“This marks the eighth consecutive edition where crane numbers have exceeded 800, suggesting building activity is staying at high levels – steady, but not surging,” he said.
“What we are seeing is a shifting of activity across different regions and asset classes.”
Mr Nichols said Sydney “remains the epicentre of national activity”, with 370 cranes in operation, down slightly from 373 in the first quarter and still representing 43.8 per cent of all cranes nationwide.
Melbourne held steady at 199 cranes, accounting for 23.6 per cent of the total, which was backed by large-scale commercial builds and major infrastructure projects such as the $36bn North-East Link project, which led the country with 46 fixed and crawler cranes in use.
The largest single-site deployment is STACK Infrastructure’s Palmers Road data centre in Truganina, Melbourne, with six fixed cranes.
Brisbane and the Gold Coast each added eight cranes, due to strong growth in Queensland’s urban corridors, particularly in mixed-use and civil sectors.
Canberra had the sharpest decline, from 22 to 12 cranes, due to the completion of civic and institutional projects.
Smaller markets such as Adelaide (+7), Wollongong (+5) and Darwin (+2) showed targeted growth, while Newcastle and the Sunshine Coast experienced modest reductions.
Adelaide (26 cranes), Gold Coast (67), and Wollongong/Shellharbour (20) each recorded their highest crane numbers on record.
Mr Nichols said that despite the overall drop in crane numbers from a year ago the overall metrics, along with construction work data, and approvals pointed to a sector that remained stable while reallocating resources.
“The emphasis is shifting towards infrastructure, density, and digital capacity, with regional hotspots and sectoral transitions shaping Australia’s next phase of development,” he said.
Residential building remains dominant, increasing from 484 to 498 cranes and now accounting for 58.9 per cent of all cranes nationally.
Mixed-use developments rose from 103 to 108 cranes, while data centres lifted from 29 to 32, reflecting the jump in this area.
Health and hotel projects had modest gains, while other sectors eased back: commercial (-12), civic (-6) and aged care (-5) as activity moves away from these areas into state-led “Big Builds” and technology-led investment.
In the June quarter, 47,063 dwellings were approved across the country – including 27,842 private houses and 19,221 apartments or townhouses with a total value nearing $24bn, representing an 18 per cent increase year-on-year.
Non-residential approvals were also strong, reaching $21.8bn for the quarter, up 30.6 per cent year-on-year, with education, office, industrial and data infrastructure projects leading the growth.
| Q1 2024 | Q3 2024 | Q1 2025 | Q3 2025 | |
| ADELAIDE | 17 | 19 | 19 | 26 |
| BRISBANE | 78 | 66 | 65 | 73 |
| CANBERRA | 26 | 30 | 22 | 12 |
| CENTRAL COAST | 12 | 17 | 14 | 13 |
| DARWIN | 0 | 2 | 2 | 4 |
| GOLD COAST | 61 | 62 | 59 | 67 |
| HOBART | 2 | 0 | 0 | 0 |
| MELBOURNE | 194 | 196 | 199 | 199 |
| NEWCASTLE | 16 | 13 | 13 | 9 |
| PERTH | 45 | 46 | 41 | 39 |
| SUNSHINE COAST | 16 | 14 | 18 | 13 |
| SYDNEY | 390 | 387 | 373 | 370 |
| WOLLONGONG | 12 | 11 | 15 | 20 |
| AUSTRALIA | 869 | 863 | 840 | 845 |
CRANE ACTIVITY IN AUSTRALIA BY CITY